PagerDuty: slo-application-2.prod-browse.5xx-errors
Summary: The Service is generating 5xx errors
Customer Impact: Errors
Actions:
Is there a bigger issue?
Join and check the following channels
Read and gain and understand what is happening so you have context, if there is a major incident(MI) in progress. Participate and add relevant notes, e.g.
Application-2 received a 5xx alert at xx:xx
If there is no MI, keep investigating the Application-2 issue.
You will need to determine if Application-2 is the cause of the problem or suffering symptoms because of a dependency issue.
Checking Application-2
Rule in/out our application
Check the 4 golden signals dashboard
Is there:
- A sustained drop in traffic and availability?
- Has latency risen?
- Is CPU usage growing?
- Is Memory saturation growing
- Has the number of replicas spiked up or down? Has it remained there?
Is this a bot?
Diagnosis:
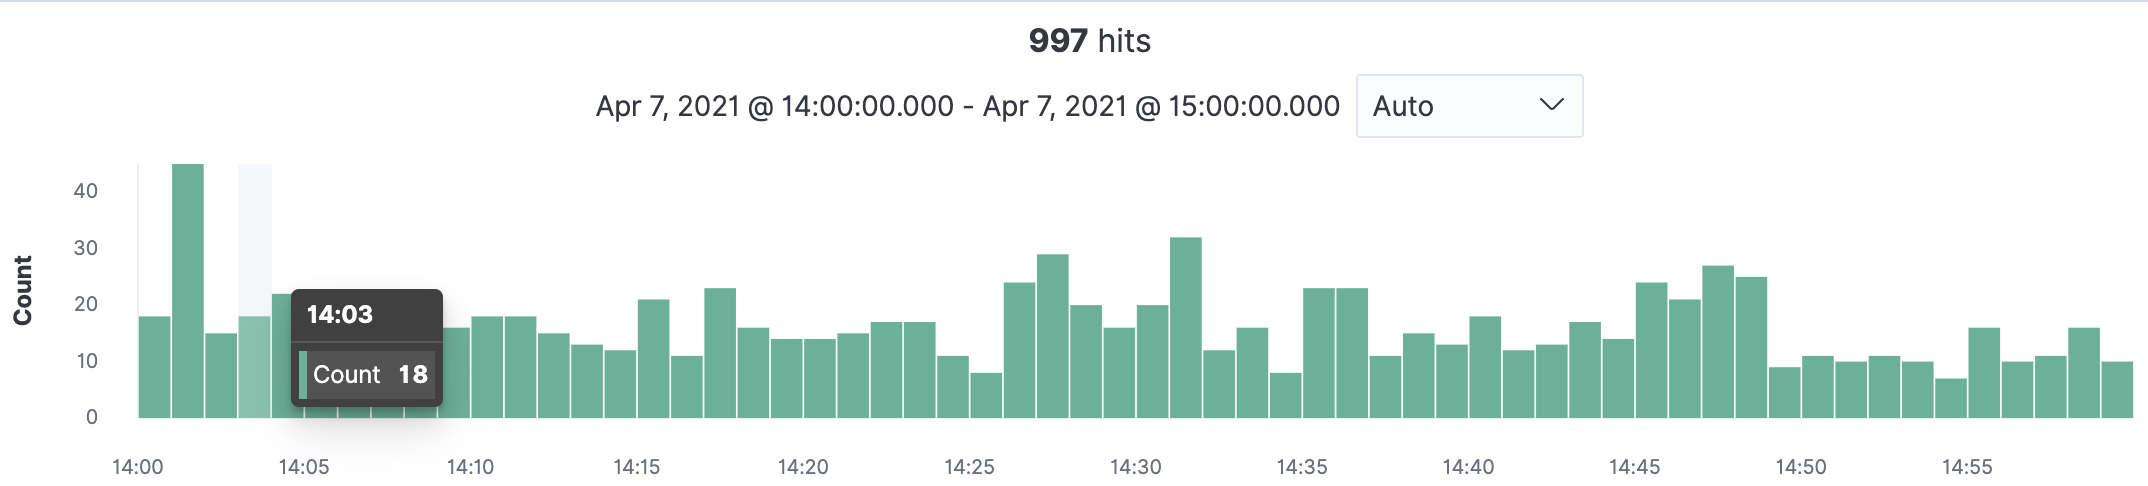
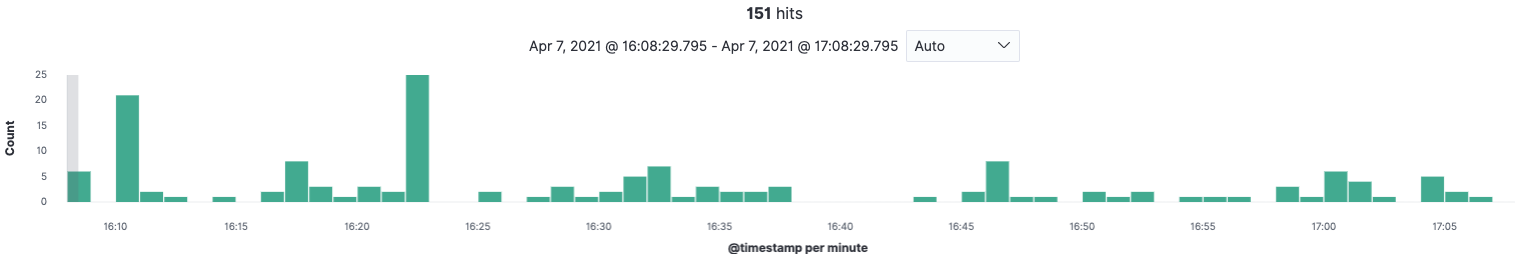
Check the past 1 hour activity through DOWNSTREAM_DEPENDENCY_B
Look for high frequency patterns of the same client IP address
Normal activity
Unusual activity
Remedial Action:
- Inform #team-x
- If there is an incident in progress, inform in the incident channel
Is UPSTREAM_DEPEDENCY_A functional?
Diagnosis:
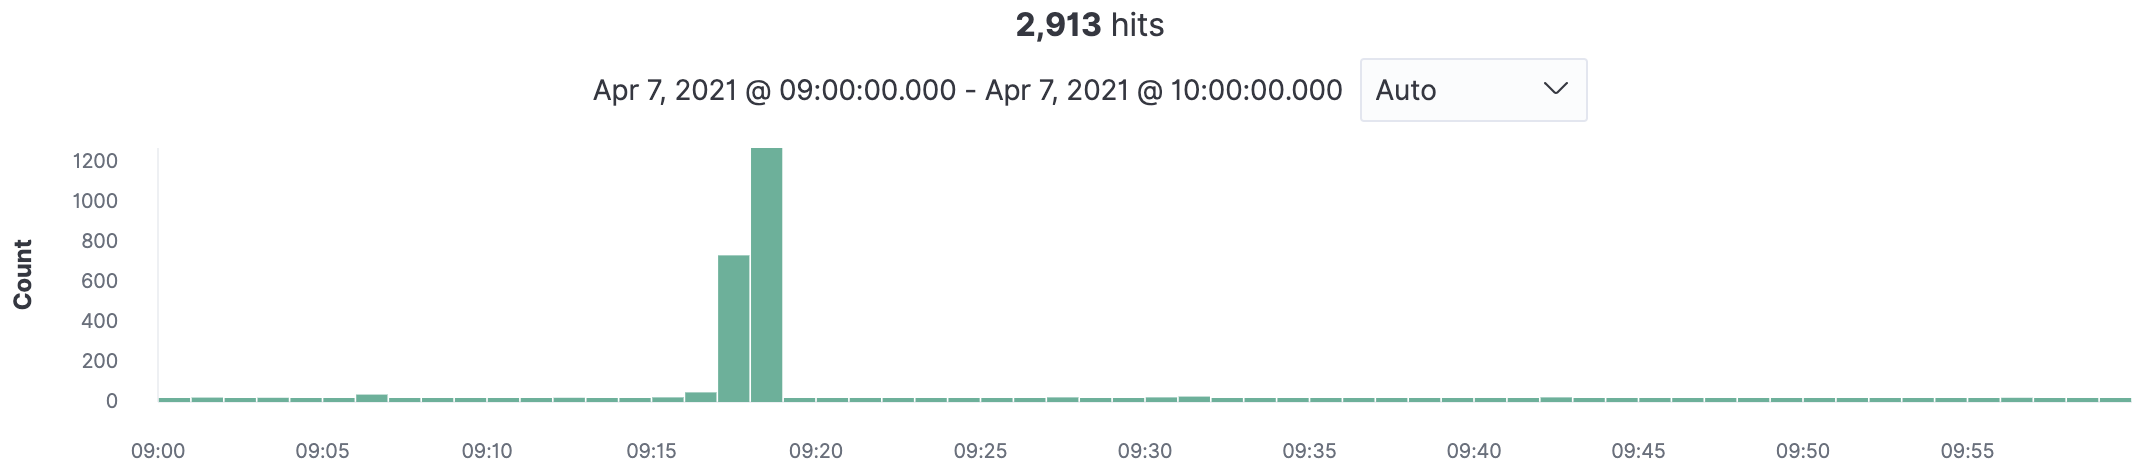
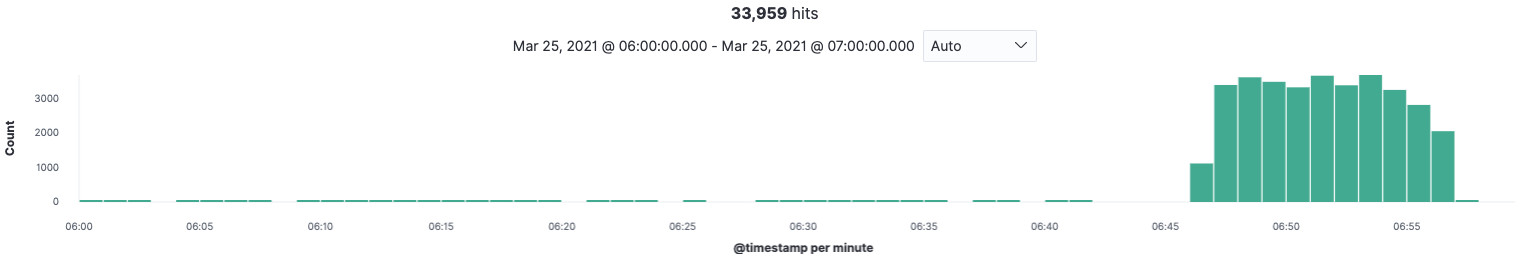
Check the past 1 hour activity through API Cache
Normal activity
Low number of hits
Unusual activity
High number of hits clustered together
Remedial Action:
- Alert Ops Bridge in #team-a
Have we performed a duff release?
Diagnosis: When was our last release?
Remedial Action:
If our neighbours aren’t breaking, consider rollback.
You will need to find the previous pipeline run to production and know how to execute it